Warning: Use of undefined constant title - assumed 'title' (this will throw an Error in a future version of PHP) in /data/www.zhuangjiba.com/web/e/data/tmp/tempnews8.php on line 170
最简单的excel数据分析使用教程
装机吧
Warning: Use of undefined constant newstime - assumed 'newstime' (this will throw an Error in a future version of PHP) in /data/www.zhuangjiba.com/web/e/data/tmp/tempnews8.php on line 171
2021年01月18日 13:06:03
每天学习一个Excel小技巧,我们离高手就会越来越近。今天我们要来一起学习的是如何通过使用 Excel 工具快速的对某些数据进行统计并对比,从而可以帮助我们进行本月数据统计以及下月数据预期。
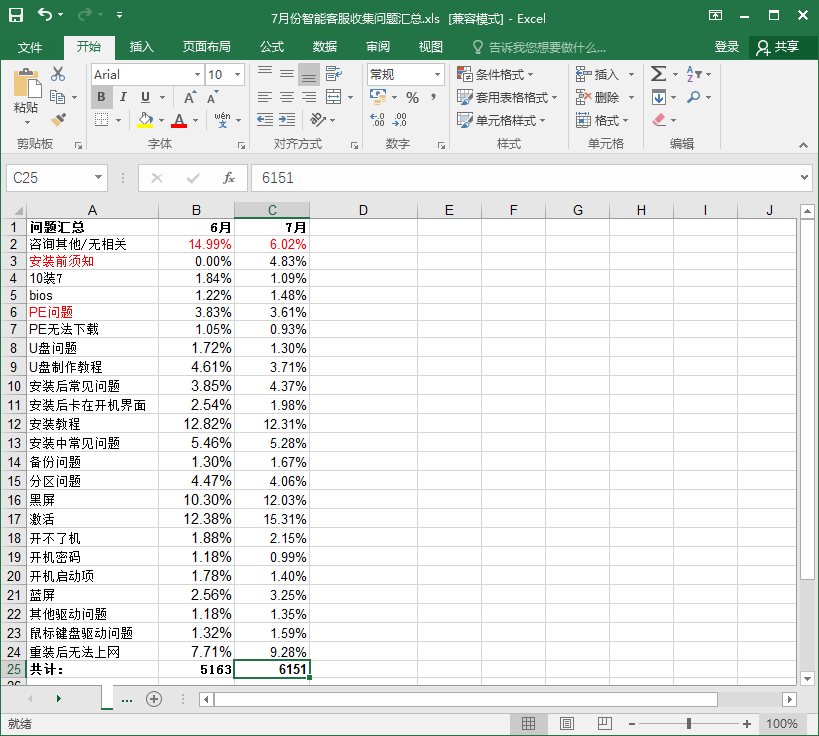
1、打开 Excel,在表格中我们录入我们不同月份的数据,这里以六月和七月份数据作为对比,同时也有给出相关的数据问题。
2、选择六月份的一组数据,然后选择在插入选项中我们找到柱状图功能选项,选择一个适合的柱形图并应用到表格上来。

3、用同样的方法去生成一份七月份的柱状图,这样我们就有两份柱状图,同时我们可以把六月份和七月份的数据进行对比。

4、或者我们选择全部的所有数据再生成一份柱状图表也可以。在图统计中我们可以看到六月份和七月份分别有哪些问题增加以及哪些问题减少等等。

以上就是最简单的excel数据分析使用教程,希望可以帮助到你哦。Excel 数据分析功能非常强大,只要想你认真研究,您就可以学会。
喜欢22